Stay on the keyboard.
Show the overlay, open the control panel, or switch to compact mode with your own shortcuts. Enable them when you’re ready.
Alt+Shift+XSuggested overlay shortcut
See what your hardware is doing, while you do your thing. A clear, customizable monitoring overlay for Windows.
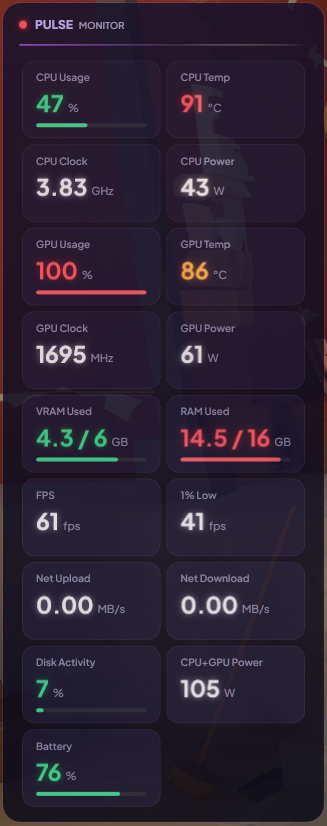
A hot CPU. Full memory. A busy graphics card.
Get the context behind how your PC feels, with the readings that matter to you.
See how hard your processor is working, how hot it’s getting, and the power it draws. Useful context for a long render or a demanding game.
4 available tilesWorkload across your cores
Processor temperature
Average core clock speed
Current processor power draw
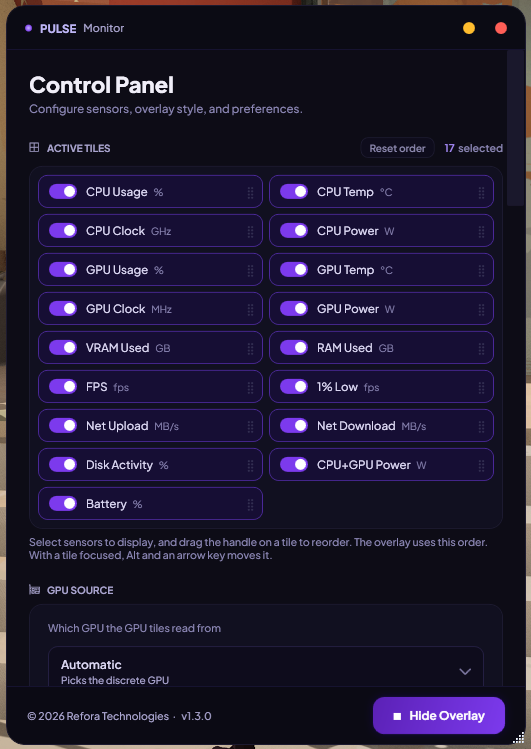
17 tiles to choose from. Sensor availability depends on your hardware and drivers. Example values above come from the supplied app screenshots.
From a full set of tiles to a quiet column of numbers. Give Pulse just the room you want it to have.
Clear tiles, color cues, and room to read. For the moments you want the whole picture.
Choose your tiles and drag them into your own order.
Snap to a corner, drag freely, or position precisely. Choose your display, too.
Adjust size and opacity. Fade the background independently of the readings.
A frame rate can look good while a few slow frames interrupt the experience. Pulse puts FPS and 1% Low side by side, so those dips have a number.
Meet your frame-rate tilesThe slow frames tell another story.1% Low reflects the 99th-percentile frame time over up to 2,000 frames or 30 seconds, whichever is shorter.
Show the overlay, open the control panel, or switch to compact mode with your own shortcuts. Enable them when you’re ready.
On a laptop or a multi-GPU PC, select the adapter to monitor. Leave it on automatic when you want Pulse to choose.
FPS capture works across GPU vendors with bundled PresentMon.Hardware monitoring happens on your PC. No account is needed. Pulse contacts GitHub to check for and download updates.
Free to use and licensed under GPLv3. Built on LibreHardwareMonitor, PresentMon, and other open-source projects.
Explore the sourceSensor reading runs in a separate process. Pulse can recover from sensor interruptions, and checks update downloads before installing.
One small overlay. A whole new perspective.
Download PulseRun PulseSetup.exe. The runtime comes with it.
Allow administrator access to read your hardware sensors.
Pick your tiles, place your overlay, and get back to your thing.